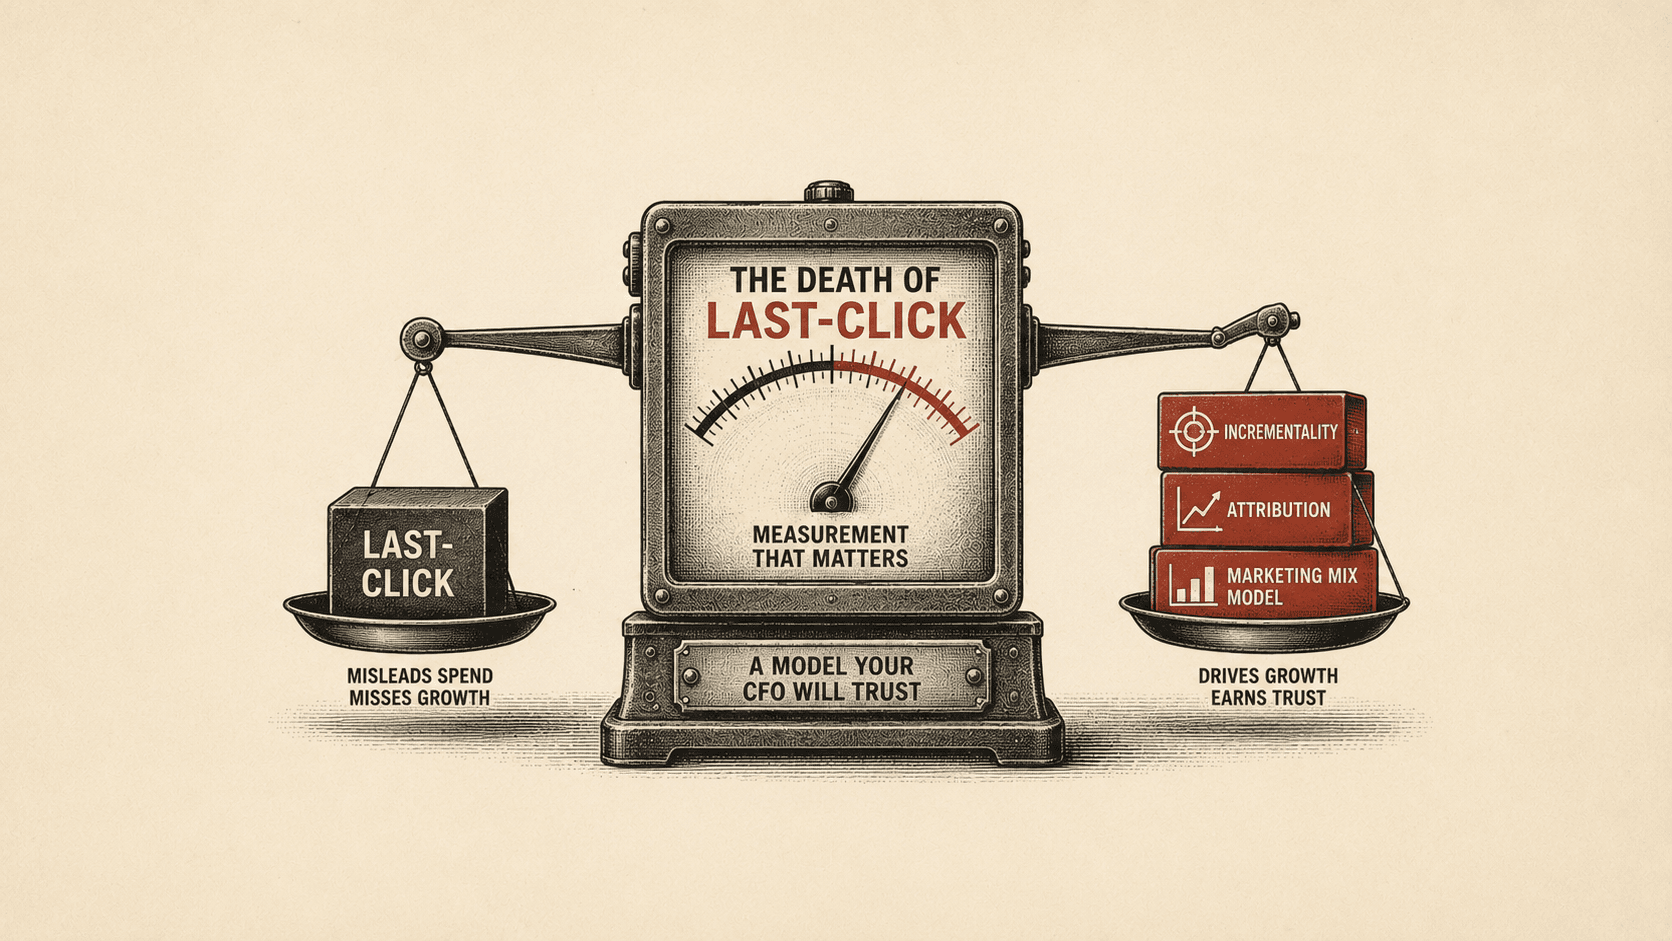
MER vs ROAS: How to Create an MER Target That Actually Means Something
Delivered ROAS is decided by the auction, not by you. Breakeven MER can be derived: 1 divided by contribution margin. Here is the full loop I run against it.

 Craig Graham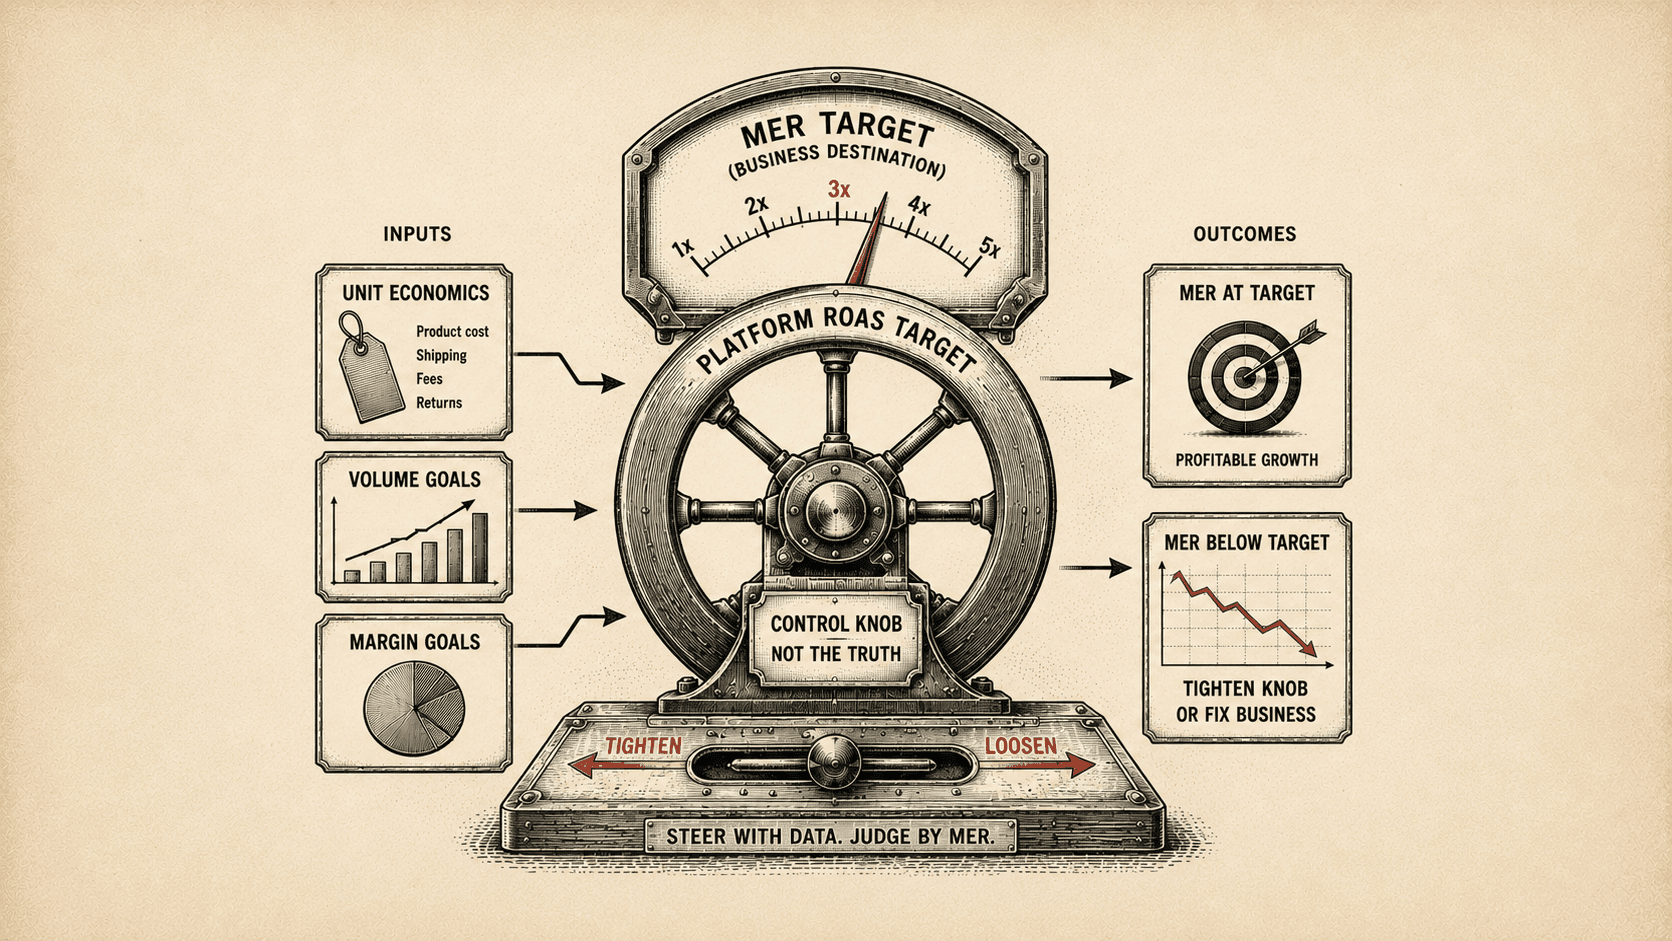
A lot of advice on ROAS targets starts from the question "what should I set my target to?" That framing assumes the number is yours to choose. For the most part, it isn't. The ROAS a campaign can deliver is decided inside the auction, by competition, ad quality, offer strength, and how much volume you're pushing. You discover it by running, more than you decide it in advance.
What you can decide, and derive line by line from your financials, is the number the business needs the whole system to hit. That number is your MER target. This walkthrough covers what MER is, how to calculate your breakeven, how to set the target, and how to use platform ROAS controls, within what the auction gives you, to steer toward it.
What is MER?
MER (marketing efficiency ratio) is total revenue divided by total advertising spend, measured across all channels at the business level.
MER = total revenue ÷ total ad spend
If a brand generates $300,000 in revenue on $100,000 of total ad spend, MER is 3.0x. Unlike platform-reported metrics, MER uses two numbers no attribution model can confuse: real revenue and real spend. That's what makes it the right level for target setting. Some teams call the same ratio blended ROAS; MER is the cleaner term because it names the difference from platform ROAS instead of blurring it.
MER vs ROAS: what's the difference?
MER measures the whole business, all revenue over all ad spend. Platform ROAS measures one platform's opinion of itself. It takes the conversion value the platform's attribution model claims and divides it by spend on that platform.
Delivered ROAS is shaped by forces you don't control. Auction competition, ad and offer quality, and the volume you're pushing all move it. Treat it as an outcome you work with rather than a truth you manage toward. On top of that, platform-reported conversion value claims sales that other channels also touched, shifts when the attribution model shifts, and moves with channel mix, brand share, and seasonality. The gap between platform ROAS and MER is not a stable constant you can convert through. And a single platform number hides incrementality entirely: a 2.3x on brand campaigns and a 2.3x on cold prospecting are very different business outcomes using the same ratio.
MER is the destination. Platform ROAS targets are the steering wheel. You derive the first from your financials. You use the second to get there.
How to calculate your breakeven MER
Breakeven MER = 1 ÷ contribution margin (as a decimal)
Three inputs get you there.
First, gather the variable costs of a sale. That means product cost (COGS, cost of goods sold), shipping and fulfillment, payment processing and platform fees, and your return rate. The first three are usually findable. The fourth quietly breaks the math if you skip it, because returns are kind of a hidden variable cost, and they're rarely distributed evenly across a catalog. In my experience, marketing teams rarely have these numbers on hand; they live with finance, operations, and the storefront backend, and pulling them into one place is often a first for the organization. It's also telling if your agency has never asked for cost data, then they're optimizing a ratio, not your business.
Second, calculate contribution margin, which is what a sale contributes after variable costs, toward fixed costs and profit.
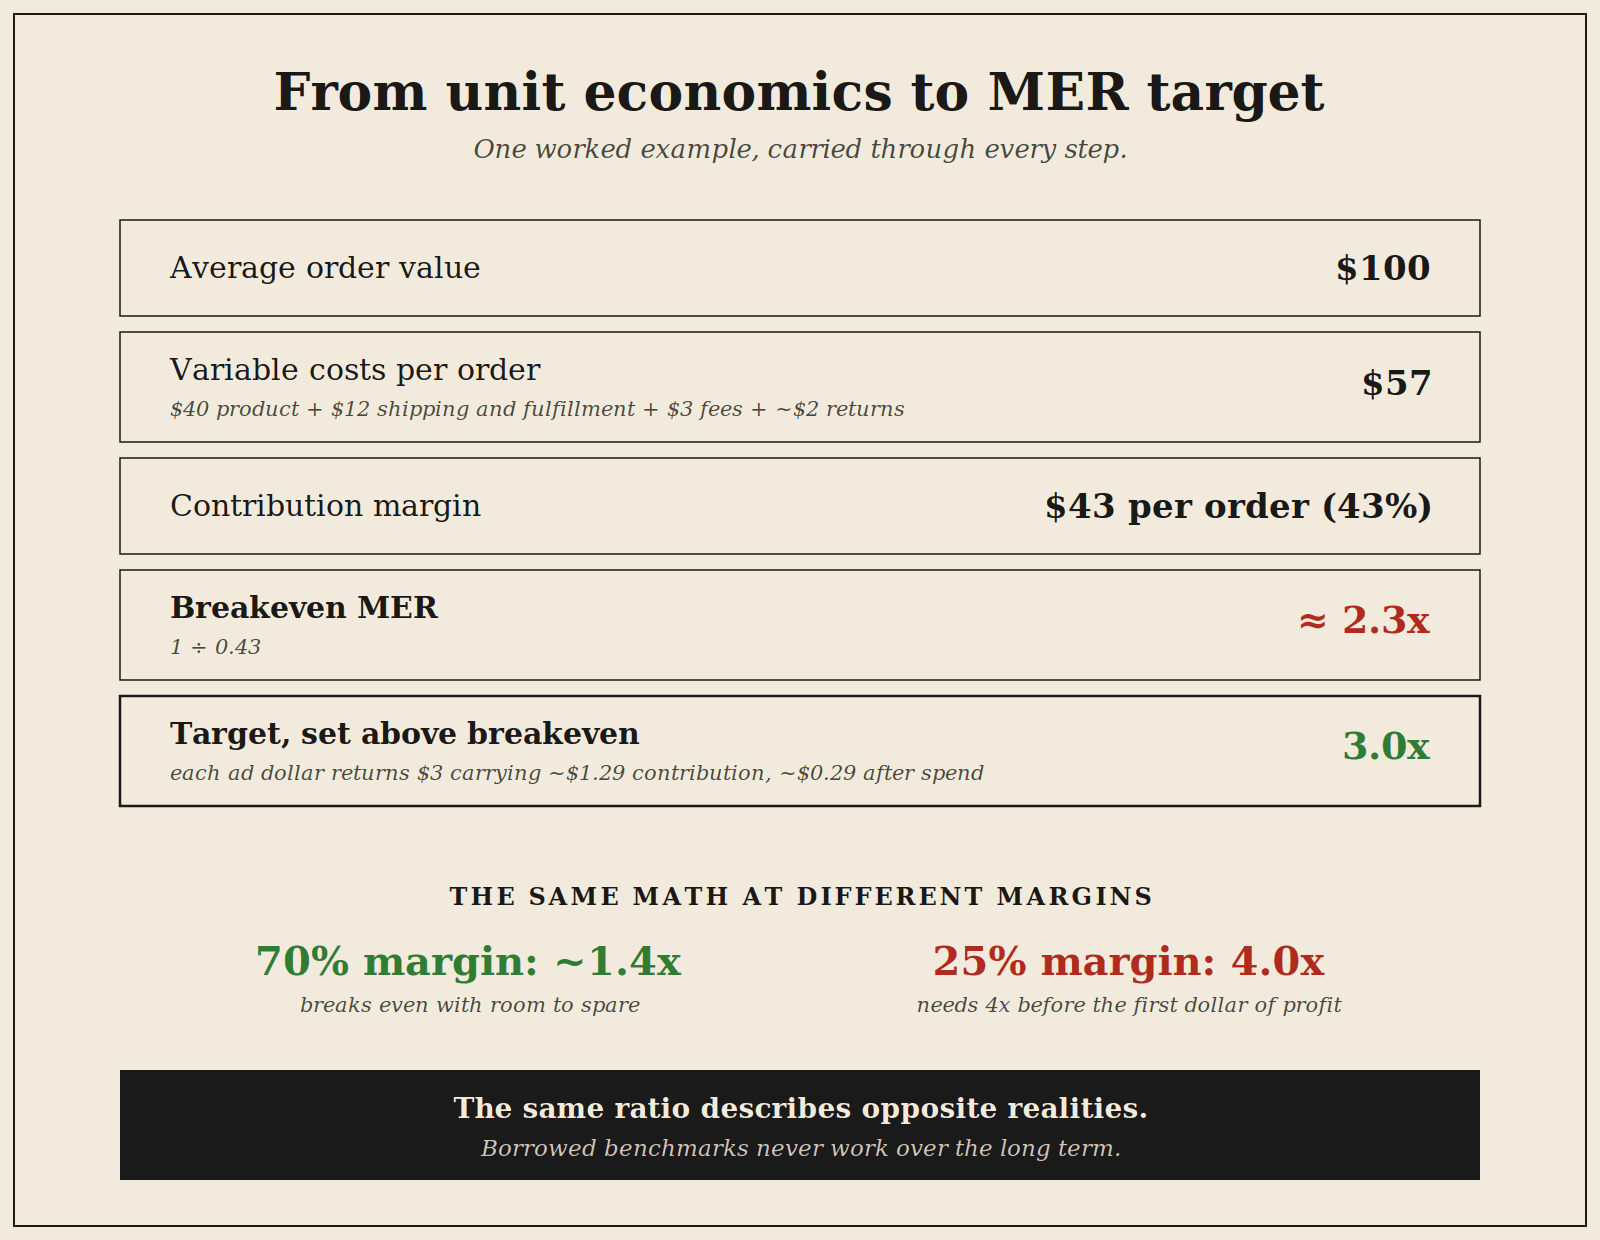
For the worked example, the average order value is $100. Product cost $40, shipping and fulfillment $12, fees $3, and a 5% return rate netting out to roughly $2 per order. Total variable cost comes to about $57. Contribution margin lands at $43 per order, or 43%.
(One precision note. Once you subtract ad spend from contribution, you're looking at contribution profit, not contribution margin. Understanding these differences is important for when this conversation reaches the finance team.)
Third, divide. If every revenue dollar contributes 43 cents, ad-driven revenue breaks even when it equals spend divided by 0.43.
Breakeven MER = 1 ÷ 0.43 ≈ 2.3x
Every blended dollar of ad spend needs about $2.30 of revenue behind it before the spend stops consuming the business.
One caveat comes with any blended number. MER includes revenue that would arrive without ads, so a brand with a strong organic baseline can sit above breakeven while the ads themselves are pulling less than their weight. The blended view is the right level for the business target, and incrementality testing (and MMM, when spend per channel is sufficient) is the tool for that deeper question.
What is a good MER?
There is no universal good MER, because breakeven depends entirely on contribution margin. A brand with 70% margins breaks even near 1.4x. A brand with 25% margins needs 4x before the first dollar of profit appears. The same ratio describes opposite realities, which is why borrowed benchmarks never work over the long term.
The important question to take away is, where does our own breakeven sit, and how far above it do we want to operate?

How to set your MER target
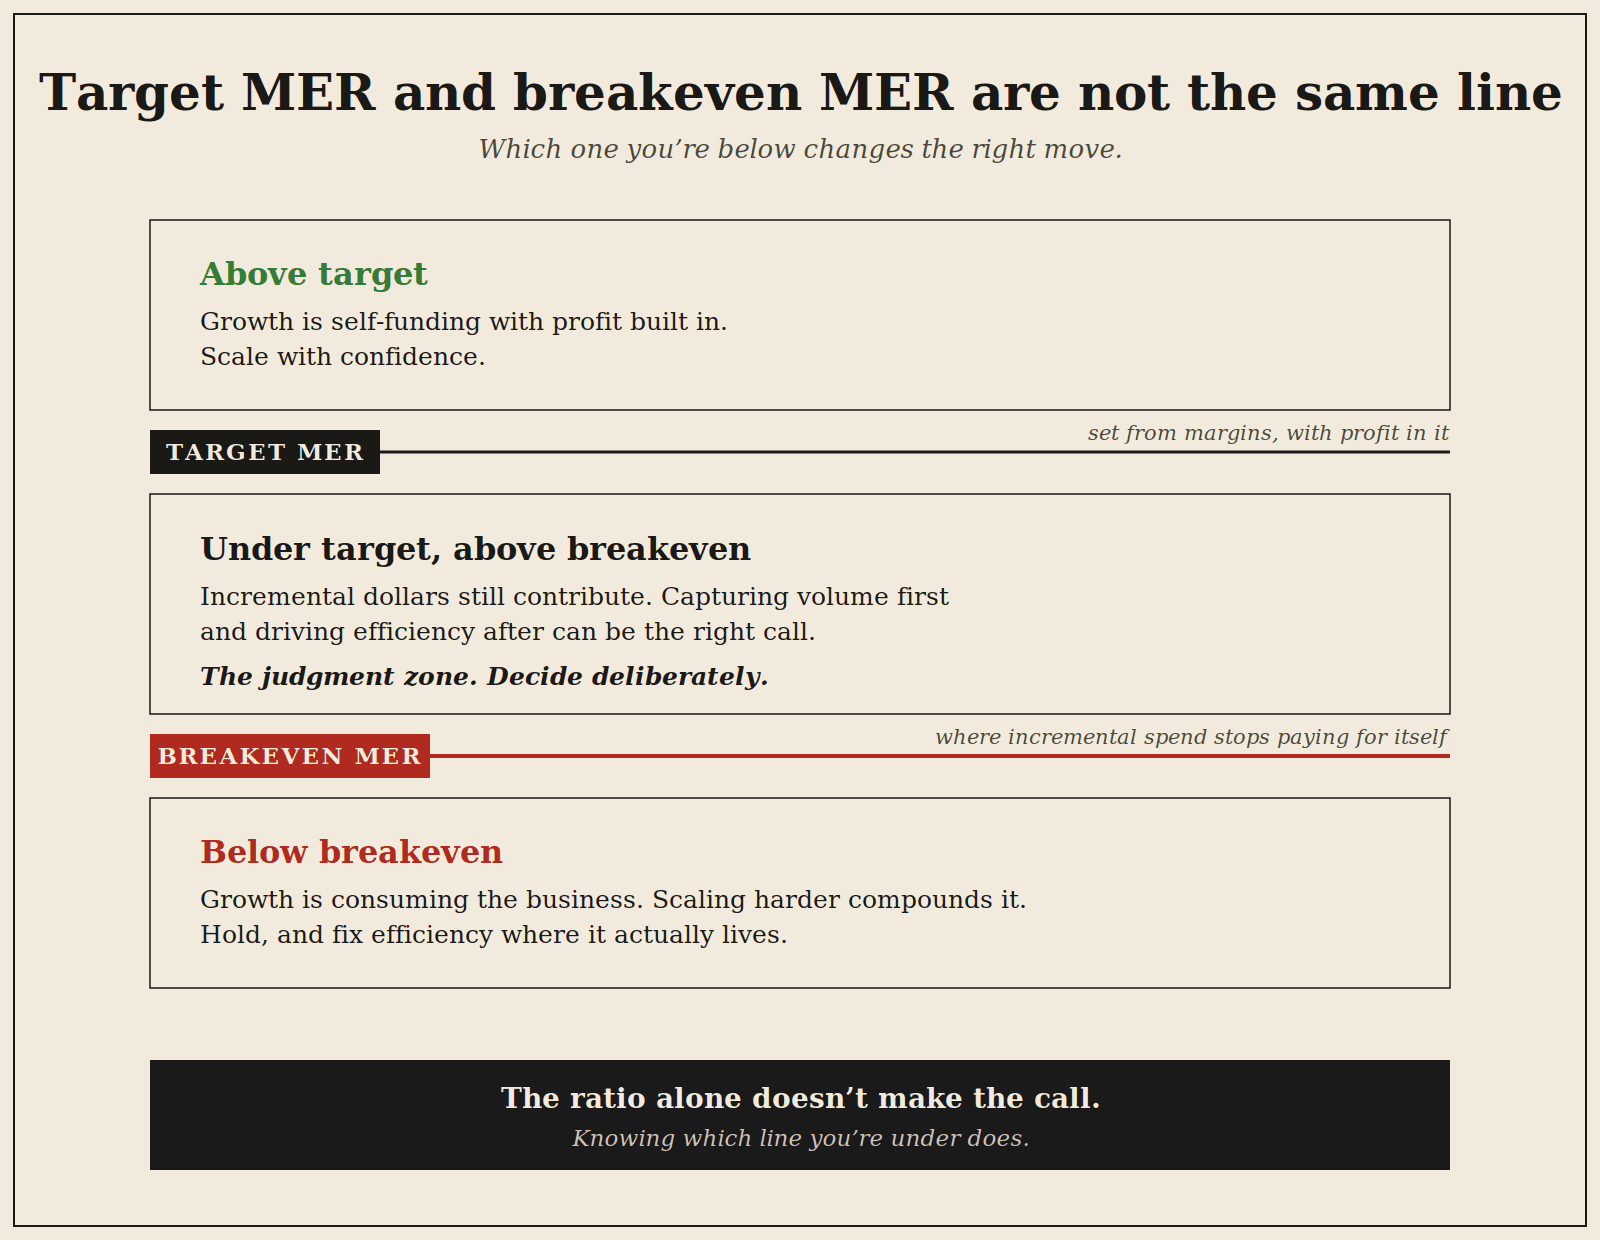
Breakeven is where you stop losing money, not where you want to live. How far above it you set the target is a business decision. A brand prioritizing growth might run close to breakeven, accepting thin contribution per order to maximize volume and new customers. A brand prioritizing profit sets the line higher.
In the worked example, a 3x MER target means each blended ad dollar returns $3 of revenue carrying about $1.29 of contribution, of which $1 repays the spend, leaving roughly 29 cents contributed per ad dollar.
Which position is right depends on the business and its goals. What is important is that the target is based in real numbers you can explain, and revisit when margins or goals change. This is the number that deserves the word "target." Everything else from here is steering.
How to hit an MER target using platform ROAS controls
Treat the platform ROAS target as what it actually is, a control knob. It doesn't need to equal anything, as long as it moves the business number in the right direction.
In practice, delivered platform ROAS and blended MER get pulled into the same view, daily, side by side. Within a few weeks you learn your account's spread, not as a conversion formula but as calibration: you know roughly where the knob sits when the business is at target. From there, steering is simple. If blended MER is running below the target you derived, tighten the knob a step. If MER is at target and volume has headroom, loosen a step. Judge every move on MER and contribution dollars, never on the knob's own readout. I treat in-platform numbers as directional, never exact. Unless you're looking at the business's actual P&L, you're not seeing what's really happening.
It is important to note that the knob only works within the range the auction allows. If the ROAS achievable at the volume you need can't produce the MER the business requires, no target setting fixes that. The conversation moves to margins, offer, creative, or channel mix, which is exactly the kind of finding this framework is built to surface early instead of after a wasted quarter.
Two things help with steering. Brand and non-brand cannot share one knob, because brand search harvests demand that largely exists already; separate them and expect different settings. And if margins vary substantially across your catalog, segment campaigns by margin band, because they have different destinations and therefore need different knobs. If you don't know your unit economics at that level, you don't have a profit lever.
Adjusting targets without breaking Smart Bidding
Whatever gap exists between the current setting and where calibration says it should sit, do not close it in one move. Smart Bidding responds to a large target change by exiting auctions it no longer expects to win profitably, and volume can fall off a cliff within days.
Google Ads Help, "About Target ROAS bidding", which notes that setting a high target ROAS can limit traffic. Also repeated first-hand observation across my own accounts after large target moves. Move in small steps, give the system time to stabilize between moves, and prefer scope controls (trimming low-margin products, weak geos, wasteful queries) over global aggression. A big target jump changes too much at once to learn anything from what happens next.
Sources & Further Reading
- Google Ads Helphttps://support.google.com/google-ads/answer/6268637?hl=en
How to measure whether it's working
After any change, the platform's ROAS column is the least useful place to look, because it's the number that improves mechanically when bidding tightens, even while revenue falls. Judge on blended MER, total revenue, and contribution dollars. If a knob adjustment improved platform ROAS while contribution shrank, the account got better-looking while the business got worse, and only the blended view catches it.
Frequently Asked Questions
- Is MER the same as blended ROAS?
- They describe the same ratio, total revenue over total ad spend. MER is the cleaner term because it names the difference from platform ROAS instead of blurring it. If your team already says blended ROAS, keep the habit and just be precise about which number is platform-reported and which is blended.
- What is a good MER for ecommerce?
- There is no useful universal answer, because breakeven depends on contribution margin. Calculate your breakeven (1 divided by contribution margin as a decimal, so 43% margin means 1 ÷ 0.43) and judge your MER against your own line. A brand at 70% margins is profitable at levels that would lose money for a brand at 25% margins.
- How often should I recalculate breakeven MER?
- Whenever the finance inputs change materially. That means supplier costs, shipping rates, pricing, product mix, or return rates. For the brands I work with, that means a scheduled check every quarter and an unscheduled one after any meaningful cost or pricing change.
The loop, not the line
Margins move. Shipping rates change, product mix shifts, return rates drift. The MER derivation isn't a one-time exercise, it's a loop you rerun when finance inputs change materially, and the knob calibration drifts with your mix, so it gets rechecked too. The brands that scale well aren't the ones with the highest targets. They're the ones who know exactly where their line is, why it's there, and when it moved.